The fleet black box: How Motion‑Mining® reveals that 3 out of 10 forklifts are redundant
Fleet analysis using Motion‑Mining® showed that just over 25% of the real forklift capacity was being used. The automatically recorded vehicle movements make it clear that real peak loads rarely occur, many “peaks” can be avoided from an organizational point of view and that at least three out of ten truck-lift trucks can be saved without risk.
3/3/2026
3
Minutes reading time
In many logistics and production environments, the actual utilization of the vehicle fleet remains largely invisible. Forklifts may be in operation, but how efficiently they are truly used, how many vehicles are actually required, and where hidden capacities lie often remain unclear. The fleet is a black box.
Experience shows that there is often a significant gap between subjective perception and real process performance.
Movement data creates transparency
Traditional observations provide only snapshots and not reliable utilization data. Motion‑Mining® closes this gap. Using mobile, manufacturer‑independent vehicle loggers, vehicle movements are recorded automatically. The data is then transferred into MotionMiners PROCESS INTELLIGENCE (MPI) and converted into meaningful KPIs.
The result is full transparency of workflows, peak loads, and unused time windows - a prerequisite for making decisions based on facts.
Deep Dive: A four-week fleet analysis
In one project, ten reach trucks were analyzed over a four‑week period. The goal was to objectively evaluate the real operational utilization of the vehicles and uncover optimization potential. The industrial trucks were involved in typical activities such as horizontal transport and inbound/outbound storage movements.
The data paints a clear picture:
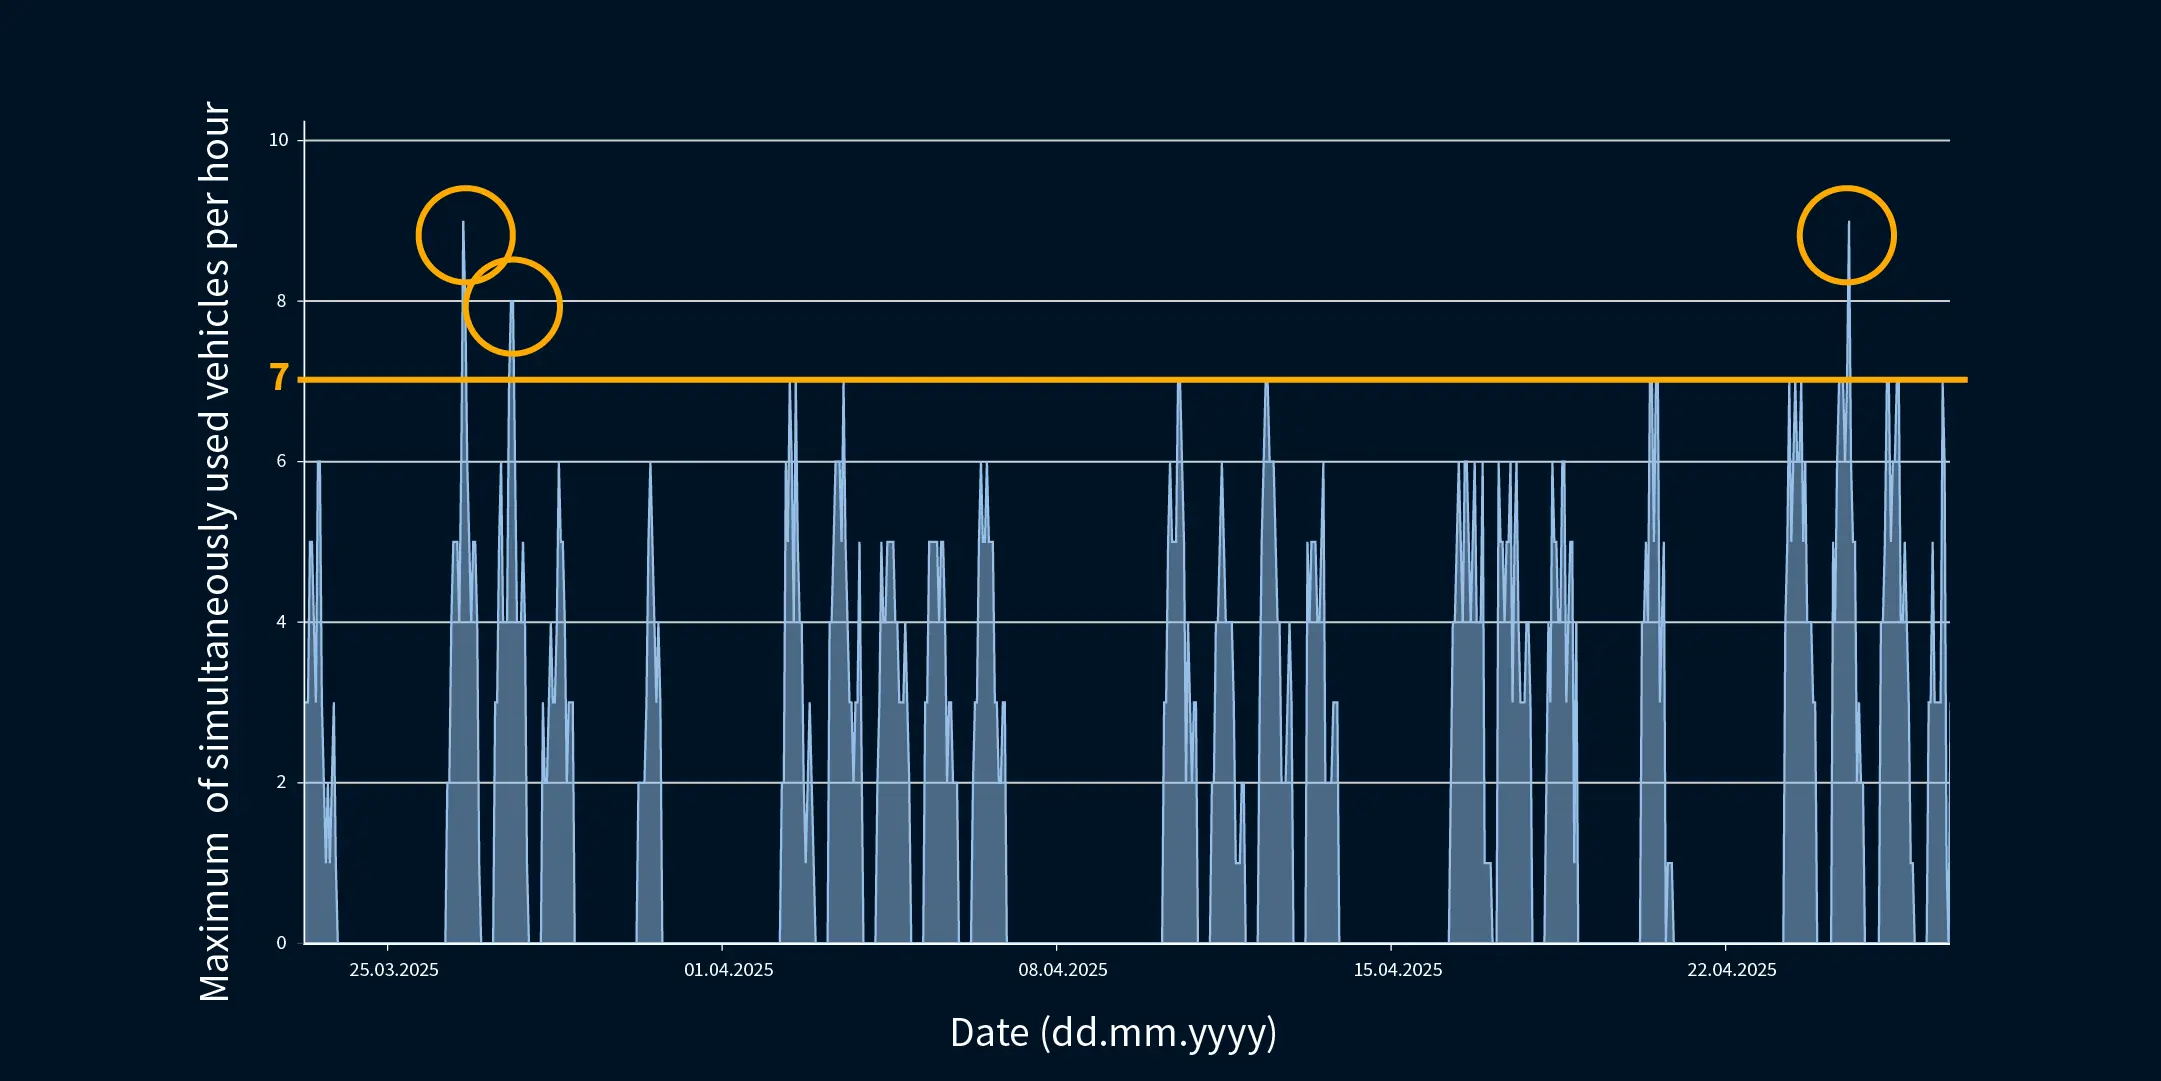
1st Insight: Maximum Simultaneity – Rarely Reached
The evaluation in the MPI platform shows:
A maximum of 9 out of 10 forklifts were moving at the same time.
These peaks occurred only very rarely.
Outside these peaks, simultaneous usage was significantly lower.
This metric already indicates: one vehicle acted permanently as a buffer and was not operationally required.
2nd Insight: The “False Peaks” – Utilization Appears Higher Than It Is
To understand whether the few peaks reflected real demand, they were analyzed in detail. The result:
Even in the rare peaks with 8–9 active vehicles, 1–2 forklifts were in use for less than 10 minutes.
The 10‑minute threshold serves as an indicator: short driving tasks under 10 minutes can typically be reassigned to already active vehicles through coordination — without causing process delays.
Conclusion: Many peaks are organizationally avoidable, not structurally necessary.
3rd Insight: Overall Utilization – Only Slightly Above 25%
Across the entire measurement period, fleet utilization amounted to slightly above 25%. This means: for three‑quarters of the time, the forklifts were not engaged in a driving process.
This significant overcapacity remains unnoticed in many companies - it only becomes visible through precise movement data.
The clear result: 30% of the fleet can be eliminated
The combination of findings leads to a clear conclusion:
low overall utilization
rare real peaks
many short movements that are organizationally avoidable
Thus, at least 3 out of 10 forklifts can be eliminated without risk. With professional fleet steering, the savings potential is often even higher.
This assessment is based on the measurement data collected during the four‑week analysis period. When making a final decision about reducing the fleet size, individual conditions should be considered - particularly seasonal fluctuations, planned volume growth, and defined safety buffers. The data provides the objective foundation; the evaluation is always made in the context of the company.
From data set to optimization: What companies can do now
The analysis not only creates transparency but forms the basis for concrete improvements:
Reduce costs: Fewer vehicles mean lower investment, maintenance, and energy costs.
Implement digital fleet management: Modern fleet‑management tools help optimize the utilization of the remaining vehicles and harmonize operating times.
Communicate and embed change: Data generates acceptance - especially where fleet reduction initially meets resistance. Transparent KPIs help managers and teams understand and jointly implement decisions. This turns analysis into a sustainable improvement process.
Conclusion: We analyze. You optimize.
Whether in industry, retail, or logistics - motion data is now the key to lean, efficient, and future‑ready intralogistics. Motion‑Mining® transforms your fleet from a black box into a data‑driven decision foundation, giving you certainty, saving resources, and accelerating your processes.
Do you want to know how many vehicles your fleet truly needs?
With MotionMiners INSIGHTS, you can independently start your data‑driven fleet analysis — without external consultants and directly in your own environment. Learn more here: MotionMiners INSIGHTS
Configure your personal INSIGHTS package quickly and easily: answer a few questions and receive a non‑binding quote for your individual license package.


.webp)

.webp)
.webp)
